# Study Sheet
# Unit 1: Functions
## Words to know:
- `linear relation`
- `quadratic relation`
- `vertex of a parabola`
- `line of best fit`
- `axis of symmetry of a parabola`
- `intercepts`
- ```Linear Relation```: A relation which a single straight line can be drawn through every data point and the first differences are constant
- ```Non - Linear Relation```: A single smooth curve can be drawn through every data point and the first differences are not constant
## Relations
- A relation can be described using
1. Table of Values (see below)
2. Equations $`(y = 3x + 5)`$
3. Graphs (Graphing the equation)
4. Words
- When digging into the earth, the temperature rises according to the
- following linear equation: $`t = 15 + 0.01 h`$. $`t`$ is the increase in temperature in
- degrees and $`h`$ is the depth in meters.
## Definitions
- ```Parallel```: 2 lines with the same slope
- ```Perpendicular```: 2 lines with slopes that are the negative reciprocal to the other. They form a 90 degree angle where they meet.
- ```Domain```: The **ordered** set of all possible values of the independent variable $`x`$.
- ```Range```: The **ordered** set of all possible values of the dependent variable $`y`$.
- ```Continous Data```: A data set that can be broken into smaller parts. This is represented by a ```Solid line```.
- ```Discrete Data```: A data set that **cannot** be broken into smaller parts. This is represented by a ```Dashed line```.
- ```First Difference```: the difference between 2 consecutive y values in a table of values which the difference between the x-values are constant.
- ```Collinear Points```: points that line on the same straight line
## Variables
- ```Independent Variable```: A Variable in a relation which the values can be chosen or isn't affected by anything.
- ```Dependent Varaible```: A Variable in a relation which is **dependent** on the independent variable.
## Scatterplot and Line of Best Fit
- A scatterplot graph is there to show the relation between two variables in a table of values.
- A line of best fit is a straight line that describes the relation between two variables.
- If you are drawing a line of best fit, try to use as many data points, have an equal amount of points onto and under the line of best fit, and keep it as a straight line.
-  ### How To Determine the Equation Of a Line of Best Fit
1. Find two points **```ON```** the ```line of best fit```
2. Determine the ```slope``` using the two points
3. Use ```point-slope form``` to find the equation of the ```line of best fit```
## Table of values
- To find first differences or any points on the line, you can use a ```table of values```
- It shows the relationship between the x and y values.
- Use `Finite differences` to figure out if its quadraic or linear:
- If the `first difference` is constant, then its linear. (degree of 1)
- If the `second difference` is constant, then its quadratic. (degree of 2)
- This is a linear function
|x |y |First difference|
|:-|:-|:---------------|
|-3|5|$`\cdots`$|
|-2|7|5-7 = 2|
|-1|9|7-9 = 2|
|0|11|9-11 = 2|
|1|13|11-13 = 2|
|2|15|15-13 =2|
- The difference between the first and second y values are the same as the difference between the third and fourth. The `first difference` is constant.
- This is a quadractic function
|x |y |First difference|Second difference|
|:-|:-|:---------------|:----------------|
|5|9|$`\cdots`$|$`\cdots`$|
|7|4|9-4 = 5|$`\cdots`$|
|9|1|4-1 = 3|5-3 = 2|
|11|0|1-0 = 1|3 - 1 = 2|
|13|1|0-1 = -1|1 -(-1) = 2|
- The difference between the differences of the first and second y values are the same as the difference of the difference between the thrid and fourth. The `second difference` is constant.
## Tips
- Label your graph correctly, the scales/scaling and always the ```independent variable``` on the ```x-axis``` and the ```dependent variable``` on ```y-axis```
- Draw your ```Line of Best Fit``` correctly
- Read the word problems carefully, and make sure you understand it when graphing things
- Sometimes its better not to draw the shape, as it might cloud your judgement (personal exprience)
- Label your lines
### Number of Solutions
-
### How To Determine the Equation Of a Line of Best Fit
1. Find two points **```ON```** the ```line of best fit```
2. Determine the ```slope``` using the two points
3. Use ```point-slope form``` to find the equation of the ```line of best fit```
## Table of values
- To find first differences or any points on the line, you can use a ```table of values```
- It shows the relationship between the x and y values.
- Use `Finite differences` to figure out if its quadraic or linear:
- If the `first difference` is constant, then its linear. (degree of 1)
- If the `second difference` is constant, then its quadratic. (degree of 2)
- This is a linear function
|x |y |First difference|
|:-|:-|:---------------|
|-3|5|$`\cdots`$|
|-2|7|5-7 = 2|
|-1|9|7-9 = 2|
|0|11|9-11 = 2|
|1|13|11-13 = 2|
|2|15|15-13 =2|
- The difference between the first and second y values are the same as the difference between the third and fourth. The `first difference` is constant.
- This is a quadractic function
|x |y |First difference|Second difference|
|:-|:-|:---------------|:----------------|
|5|9|$`\cdots`$|$`\cdots`$|
|7|4|9-4 = 5|$`\cdots`$|
|9|1|4-1 = 3|5-3 = 2|
|11|0|1-0 = 1|3 - 1 = 2|
|13|1|0-1 = -1|1 -(-1) = 2|
- The difference between the differences of the first and second y values are the same as the difference of the difference between the thrid and fourth. The `second difference` is constant.
## Tips
- Label your graph correctly, the scales/scaling and always the ```independent variable``` on the ```x-axis``` and the ```dependent variable``` on ```y-axis```
- Draw your ```Line of Best Fit``` correctly
- Read the word problems carefully, and make sure you understand it when graphing things
- Sometimes its better not to draw the shape, as it might cloud your judgement (personal exprience)
- Label your lines
### Number of Solutions
-  ## Discriminant
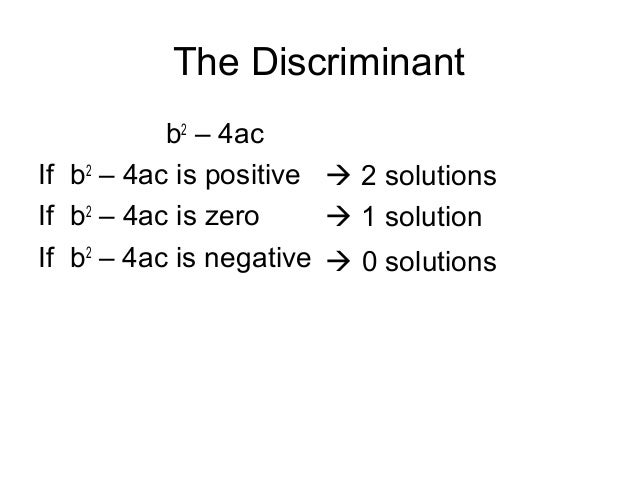
- The discriminant determines the number of solutions (roots) there are in a quadratic equation. $`a, b , c`$ are the
- coefficients and constant of a quadratic equation: $`y = ax^2 + bx + c`$
$`
D = b^2 - 4ac
\begin{cases}
\text{2 distinct real solutions}, & \text{if } D > 0 \\
\text{1 real solution}, & \text{if } D = 0 \\
\text{no real solutions}, & \text{if } D < 0
\end{cases}
`$
-
## Discriminant
- The discriminant determines the number of solutions (roots) there are in a quadratic equation. $`a, b , c`$ are the
- coefficients and constant of a quadratic equation: $`y = ax^2 + bx + c`$
$`
D = b^2 - 4ac
\begin{cases}
\text{2 distinct real solutions}, & \text{if } D > 0 \\
\text{1 real solution}, & \text{if } D = 0 \\
\text{no real solutions}, & \text{if } D < 0
\end{cases}
`$
-  ### Tips
- Read the questions carefully and model the system of equations correctly
- Be sure to name your equations
- Label your lines
## Definitions
- `Function`: a relation which there is only one value of the dependent variable for each value of the independent variable (i.e, for every x-value, there is only one y-value).
- `Vertical-line test`: a test to determine whether the graph of a relation is a function. The relation is not a function if at least one vertical line drawn through the graph of the relation passes through two or more points.
- `Real numbers`: the set of real numbers is the set of all decimals - positive, negative and 0, terminating and non-terminating. This statement is expressed mathematically with the set notation $`\{x \in \mathbb{R}\} `$
- `Degree`: the degree of a polynomial with a single varible, say $`x`$, is the value of the highest exponent of the variable. For example, for the polynomial $`5x^3-4x^2+7x-8`$, the highest power or exponent is 3; the degree of the polynomial is 3.
- `Function notation`: $`(x, y) = (x f(x))`$. $`f(x)`$ is called function notation and represents the value of the dependent variable for a given value of the independent variable $`x`$.
- `Transformations`: transformation are operations performed on functions to change the position or shape of the associated curves or lines.
## Working with Function Notation
- Given an example of $`f(x) = 2x^2+3x+5`$, to get $`f(3)`$, we substitute the 3 as $`x`$ into the function, so it now becomses $`f(3) = 2(3)^2+3(3)+5`$.
- We can also represent new functions, the letter inside the brackets is simply a variable, we can change it.
- Given the example $`g(x) = 2x^2+3x+x`$, if we want $`g(m)`$, we simply do $`g(m) = 2m^2+3m+m`$.
## Vertex Form
- `Vertex from`: $`f(x) = a(x-h)^2 + k`$.
- $`(-h, k)`$ is the coordinates of the vertex
## Axis of symmetry
- $`x = -h`$
- Example:
- $`f(x) = 2(x-3)^2+7`$
- $`x = +3`$
-
### Tips
- Read the questions carefully and model the system of equations correctly
- Be sure to name your equations
- Label your lines
## Definitions
- `Function`: a relation which there is only one value of the dependent variable for each value of the independent variable (i.e, for every x-value, there is only one y-value).
- `Vertical-line test`: a test to determine whether the graph of a relation is a function. The relation is not a function if at least one vertical line drawn through the graph of the relation passes through two or more points.
- `Real numbers`: the set of real numbers is the set of all decimals - positive, negative and 0, terminating and non-terminating. This statement is expressed mathematically with the set notation $`\{x \in \mathbb{R}\} `$
- `Degree`: the degree of a polynomial with a single varible, say $`x`$, is the value of the highest exponent of the variable. For example, for the polynomial $`5x^3-4x^2+7x-8`$, the highest power or exponent is 3; the degree of the polynomial is 3.
- `Function notation`: $`(x, y) = (x f(x))`$. $`f(x)`$ is called function notation and represents the value of the dependent variable for a given value of the independent variable $`x`$.
- `Transformations`: transformation are operations performed on functions to change the position or shape of the associated curves or lines.
## Working with Function Notation
- Given an example of $`f(x) = 2x^2+3x+5`$, to get $`f(3)`$, we substitute the 3 as $`x`$ into the function, so it now becomses $`f(3) = 2(3)^2+3(3)+5`$.
- We can also represent new functions, the letter inside the brackets is simply a variable, we can change it.
- Given the example $`g(x) = 2x^2+3x+x`$, if we want $`g(m)`$, we simply do $`g(m) = 2m^2+3m+m`$.
## Vertex Form
- `Vertex from`: $`f(x) = a(x-h)^2 + k`$.
- $`(-h, k)`$ is the coordinates of the vertex
## Axis of symmetry
- $`x = -h`$
- Example:
- $`f(x) = 2(x-3)^2+7`$
- $`x = +3`$
-  ## Direction of openning $`\pm a`$
- Given a quadratic in the from $`f(x) = ax^2+bx+c`$, if $`a > 0`$, the curve is a happy face, a smile. If $`a < 0`$, the curve is a sad face, a sad frown.
- $`
\text{Opening} =
\begin{cases}
\text{if } a > 0, & \text{opens up} \\
\text{if } a < 0, & \text{opens down}
\end{cases}
`$
- Examples
- $`f(x) = -5x^2`$ opens down, sad face.
- $`f(x) = 4(x-5)^2+7`$ opens up, happy face.
## Vertical Translations $`\pm k`$
- $`
\text{Direction} =
\begin{cases}
\text{if } k > 0, & \text{UP }\uparrow \\
\text{if } k < 0, & \text{DOWN } \downarrow
\end{cases}
`$
## Horizontal Translations $`\pm h`$
- $`
\text{Direction} =
\begin{cases}
\text{if } -h > 0, & \text{shift to the right} \\
\text{if } -h < 0, & \text{shift to the left}
\end{cases}
`$
- $`f(x) = 1(x-4)^2`$
- $`\uparrow`$ congruent to $`f(x) = x^2`$
-
## Vertical Stretch/Compression
- $`|a|\leftarrow`$: absolute bracket.
- simplify and become positive
- $`
\text{Stretch/Compression} =
\begin{cases}
\text{if } |a| > 1, & \text{stretch by a factor of } a \\
\text{if } 0 < |a| < 1, & \text{compress by a factor of } a
\end{cases}
`$
- (Multiply all the y-values from $`y = x^2`$ by a)
- (Not congruent to $`f(x) = x^2`$)
- Example of stretching
- $`f(x) = 2x^2`$
-Vertically stretch by a factor of 2
- |x |y |
|:-|:-|
|-3|9`(2)` = 18|
|-2|4`(2)` = 8|
|-1|1`(2)`= 2|
|0|0`(2)` = 0|
|1|1`(2)` = 2|
|2|4`(2)`= 8|
|3|9`(2)` = 18|
- All y-values from $`f(x) =x^2`$ are now multiplied by 2 to create $`f(x)=2x^2`$
- Example of compression
- $`f(x) = \frac{1}{2}x^2`$
- Verticallyc ompressed by a factor of $`\frac{1}{2}`$
- |x |y |
|:-|:-|
|-3|9$`(\frac{1}{2})`$ = 4.5|
|-2|4$`(\frac{1}{2})`$ = 2|
|-1|1$`(\frac{1}{2})`$ = $`\frac{1}{2}`$|
|0|0$`(\frac{1}{2})`$ = 0|
|1|1$`(\frac{1}{2})`$ = 1|
|2|4$`(\frac{1}{2})`$= $`\frac{1}{2}`$|
|3|9$`(\frac{1}{2})`$ = 4.5|
- All y-values from $`f(x) = x^2`$ are now multiplied by $`\frac{1}{2}`$ to create $`f(x) = \frac{x^2}{2}`$
## Direction of openning $`\pm a`$
- Given a quadratic in the from $`f(x) = ax^2+bx+c`$, if $`a > 0`$, the curve is a happy face, a smile. If $`a < 0`$, the curve is a sad face, a sad frown.
- $`
\text{Opening} =
\begin{cases}
\text{if } a > 0, & \text{opens up} \\
\text{if } a < 0, & \text{opens down}
\end{cases}
`$
- Examples
- $`f(x) = -5x^2`$ opens down, sad face.
- $`f(x) = 4(x-5)^2+7`$ opens up, happy face.
## Vertical Translations $`\pm k`$
- $`
\text{Direction} =
\begin{cases}
\text{if } k > 0, & \text{UP }\uparrow \\
\text{if } k < 0, & \text{DOWN } \downarrow
\end{cases}
`$
## Horizontal Translations $`\pm h`$
- $`
\text{Direction} =
\begin{cases}
\text{if } -h > 0, & \text{shift to the right} \\
\text{if } -h < 0, & \text{shift to the left}
\end{cases}
`$
- $`f(x) = 1(x-4)^2`$
- $`\uparrow`$ congruent to $`f(x) = x^2`$
-
## Vertical Stretch/Compression
- $`|a|\leftarrow`$: absolute bracket.
- simplify and become positive
- $`
\text{Stretch/Compression} =
\begin{cases}
\text{if } |a| > 1, & \text{stretch by a factor of } a \\
\text{if } 0 < |a| < 1, & \text{compress by a factor of } a
\end{cases}
`$
- (Multiply all the y-values from $`y = x^2`$ by a)
- (Not congruent to $`f(x) = x^2`$)
- Example of stretching
- $`f(x) = 2x^2`$
-Vertically stretch by a factor of 2
- |x |y |
|:-|:-|
|-3|9`(2)` = 18|
|-2|4`(2)` = 8|
|-1|1`(2)`= 2|
|0|0`(2)` = 0|
|1|1`(2)` = 2|
|2|4`(2)`= 8|
|3|9`(2)` = 18|
- All y-values from $`f(x) =x^2`$ are now multiplied by 2 to create $`f(x)=2x^2`$
- Example of compression
- $`f(x) = \frac{1}{2}x^2`$
- Verticallyc ompressed by a factor of $`\frac{1}{2}`$
- |x |y |
|:-|:-|
|-3|9$`(\frac{1}{2})`$ = 4.5|
|-2|4$`(\frac{1}{2})`$ = 2|
|-1|1$`(\frac{1}{2})`$ = $`\frac{1}{2}`$|
|0|0$`(\frac{1}{2})`$ = 0|
|1|1$`(\frac{1}{2})`$ = 1|
|2|4$`(\frac{1}{2})`$= $`\frac{1}{2}`$|
|3|9$`(\frac{1}{2})`$ = 4.5|
- All y-values from $`f(x) = x^2`$ are now multiplied by $`\frac{1}{2}`$ to create $`f(x) = \frac{x^2}{2}`$