36 KiB
Math Study Sheet!!!!
Exam Detail
Unit Marks Unit 1 10 Unit 2 10 Unit 3 9 Unit 4 11 Unit 5 11 Unit 6 8 Forms 4 Total 63
Section Marks Knowledge 21 Application 23 Thinking 12 Communication 3 Forms 4
Part Question A 9 multiple choice B 10 Short Answer –>
- 7 Knowledge questions
- 30 Application QuestionsC 10 Open Response –>
- 10 Knowledge Questions
- 5 Application Questions
- 3 Thinking Questions
- 1 Communication Question
Essential Skills (1)
Simple Arithmetics
Addition / Subtraction
Expression Equivalent a + b a + b (-a) + b b - a a + (-b) a - b (-a) + (-b) -(a + b) a - b a - b a - (-b) a + b (-a) -(-b) (-a) + b
Multiplication / Division
Signs Outcome a * b Positive (-a) * b Negative a * (-b) Negative (-a) * (-b) Positive
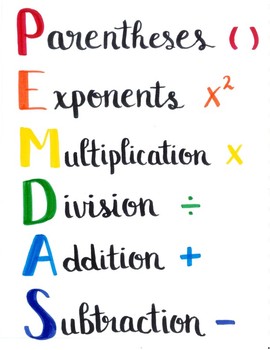
BEDMAS / PEMDAS
Follow
BEDMASfor order of operations if there are more than one operation
Letter Meaning B / P Bracket / Parentheses E Exponent D Divison M Multiplication A Addition S Subtraction
Interval Notation
A notation that represents an interval as a pair of numbers.
The numbers in the interval represent the endpoint. E.g. [x > 3, x ∈ R]
|meanssuch that
Eor ∈ meanselement of
Wrepresents Whole Numbers (W = {x | x > 0, x ∈ Z})
Nrepresents Natural Numbers (N = {x | x ≥ 0, x ∈ Z})
Zrepresents Integers (Z = {x | -∞ ≤ x ≤ ∞, x ∈ Z})
Qrepresents Rational Numbers (Q = {a⁄b |a, b ∈ Z, b ≠ 0})
Symbol Meaning (a, b) Between but not including aorb, you also use this for∞[a, b] Inclusive a ∪ b Union (or) a ∩ b Intersection (and)
Pythgorean Theorem
a and b are the two legs of the triangle or two sides that form a 90 degree angle of the triangle, c is the hypotenuse
a2 + b2 = c2
Operations with Rationals
Any operations with rationals, there are 2 sets of rules
> 1.Rules for operations with integers> 2.Rules for operations with fractions
To Add / subtract rationals, find common denominator and then add / subtract numerator
To Multiply rationals, first reduce the fraction to their lowest terms, then multiply numerators and denominators
To Divide rationals, multiply them by the reciprocal
### Example Simplify Fully: >[Reduce to lowest terms]
Shortcut for multiplying fractions
Exponent Laws
Rule Description Example Product am × an = an+m 23 × 22 = 25 Quotient am ÷ an = an-m 34 ÷ 32 = 32 Power of a Power (am)n = amn (23)2 = 26 Power of a Quotient =
=
Zero as Exponents a0 = 1 210 = 1 Negative Exponents a-m = 1-10 = Rational Exponents an/m = =
Note:
Exponential Form –> Expanded Form
64 = 6 × 6 × 6 × 6
Scientific Notation
They convey accuracy and precision. It can either be written as its original number or in scientific notation: 555 (Exact) or 5.55 x 10² (3 significant figures).
In scientific notation, values are written in the form a(10n), whereais a number within 1 and 10 andnis any integer. Some examples include the following: 5.4 x 10³, 3.0 x 10², and 4.56 x 10⁻⁴.
When the number is smaller than 1, a negative exponent is used, when the number is bigger than 10, a positve exponent is used
Remember: For scientific notation, round to
3 significantdigits
Rates, Ratio and Percent
Ratio: A comparison of quantities with the same unit. These are to be reduced to lowest terms.
Examples:a:b, a:b:c, a/b, a to b
Rates: A comparison of quantities expressed in different units.
Example:10km/hour
Percent: A fraction or ratio in which the denominator is 100
Examples:50%, 240/100
Number Lines
a line that goes from a point to another point, a way to visualize set notations and the like
A solid filled dot is used for[]and a empty dot is used for()
Tips
Watch out for the
+/-signs
Make sure to review your knowledge of the exponent laws
For scientific notation, watch out for the decimal point Use shortcut when multiplying fractions
Polyomials (2)
Introduction to Polynomials
A
variableis a letter that represents one or more numbers
Analgebraic expressionis a combination of variables and constants(e.g. x+y+6 = 5)
When a specific value is assigned to a variable in a algebraic expression, this is known as substitution.
## Methods to solve a polynomial 1.Combine like terms2.Dividing polynomials3.Multiplying polynomials
Simplifying Alegebraic Expressions
An algebraic expression is an expression with numbers, variables, and operations. You may expand or simplify equations thereon.
Factoring
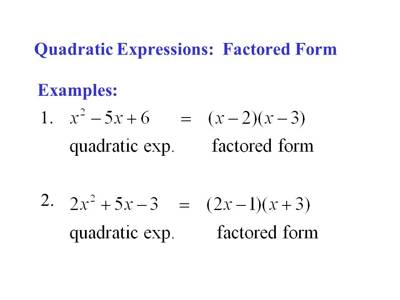
Two methods of solving; decomposition and criss-cross. First of all, the polynomial must be in the form of a quadratic equation (ax2 + bx + c). As well, simplify the polynomial, so that all common factors are outside
(e.g 5x + 10 = 5(x + 2) ).
Type of Polynomial Definition Monomial Polynomial that only has one term Binomial Polynomial that only has 2 terms Trinomial polynomial that only has 3 terms
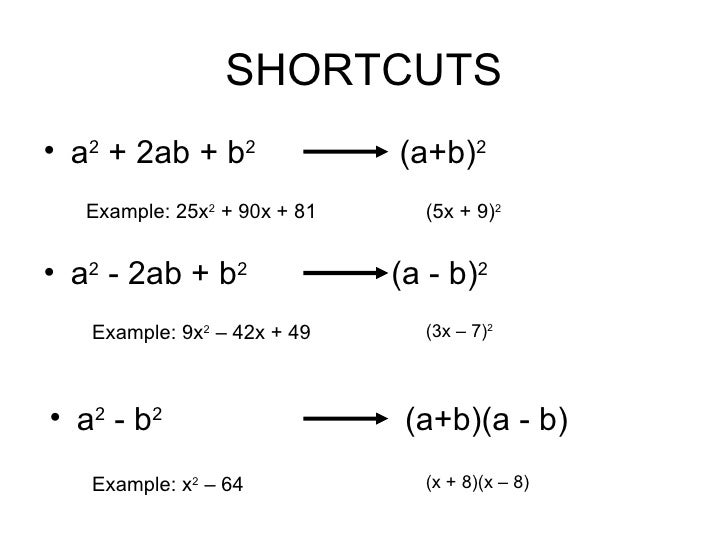
Type Example Perfect Square Trinomials (a+b)2 = a2+2ab+b2 or (a-b)2 = a2-2ab+b Difference with Squares a2-b2 = (a+b)(a-b) Simple Trinomials x2+6x-7 = (x+7)(x-1) Complex Trinomials 2x2-21x-11 = (2x+1)(x-11) Common Factor 2ab+6b+4 = 2(ab+3b+2) Factor By Grouping ax+ay+bx+by = (ax+ay)+(bx+by) = a(x+y)+b(x+y) = (a+b)(x+y)
Shortcuts
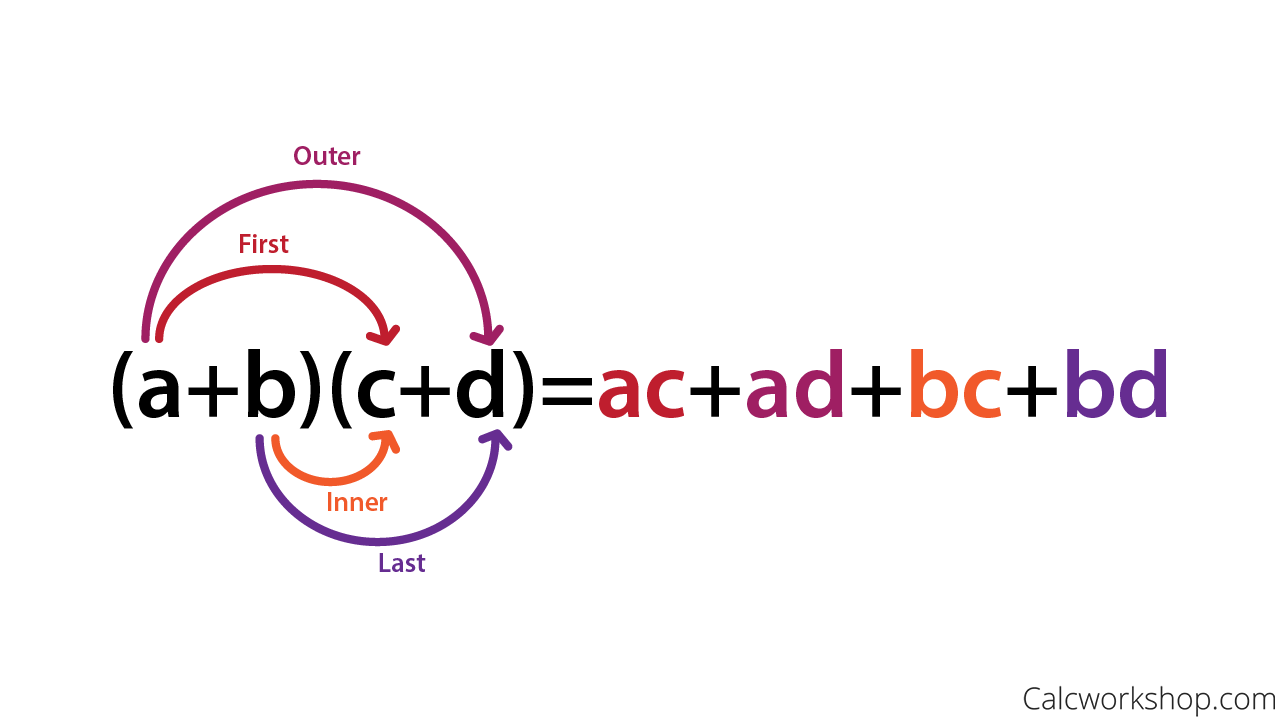
Foil / Rainbow Method
Definitions
Terma variable that may have coefficient(s) or a constant
Alebraic Expressions: made up of one or more terms
Like-terms: same variables raised to the same exponent
Tips
Be sure to factor fully
Learn thecriss-cross(not mandatory but its a really good method to factor quadratics)
Learnlong division(not mandatory but its a really good method to find factors of an expression)
Remember your formulas
Simplify first, combine like terms
Solving Equations and Inequailties (3)
Equations
a
mathematical statementin which the value on theleft sideequals the value on theright sideof the equal sign
Tosolveand equation is to find the variable that makes the statement true ### Methods to solve an equation > 1. Expand and simplify both sides > 2. Isolate using reverse order of operations > 3. Check the solution by plugging the variable back into the equation and check if theleft sideequals theright side
Absolute Values
There are 2 cases. For this sort of equation, you must split the equation into 2 separate equations. One of the equations will have the absolute bracket be positive while the other negative.
Absolute values are written in the form| x |where
if x > 0, | x | = x
if x = 0, | x | = 0
if x < 0, | x | = -x
Quadractic Equations
Quadratic Function: A parabolic graph where the axis of symmetry is parallel to the y-axis
Quadratic Equation: This function is set equal to0. The solution to the equation are calledroots
Solve quadratic equation by:
1. Isolation
a(x+b)2 + k = 0 2. Factor using zero-product property
The Zero Factor Propertyrefers to when a×b=0, then either a=0 or b=0.
(x-a)(x-b)=0
x = a, b
Note:
√x2 = ± x (There are 2 possible solutions)Distrubutive Property- This is opening the bracket. a(x+y) = ax+ay
Tips
Absolute Valuescan have 2 solutions
Quadraticscan also have 2 solutions
Make sure to do the reverse when moving things to the other side, meaning a positive on theleft sidebecomes a negative on theright side
Measurement and Geometry (4)
Angle Theorems
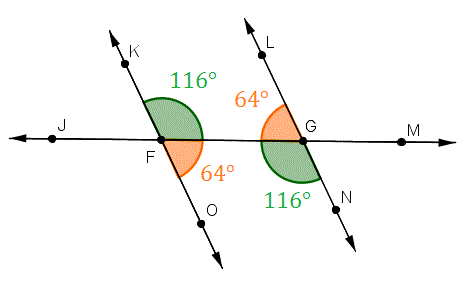
Transversal Parallel Line Theorems(TPT)
- Alternate Angles are Equal
(Z-Pattern)
- Corresponding Angles Equal
(F-Pattern)
- Interior Angles add up to 180
(C-Pattern)
Supplementary Angle Triangle(SAT)
- When two angles add up to 180 degrees
Opposite Angle Theorem (OAT)(OAT)
- Two lines intersect, two angles form opposite. They have equal measures
Complementary Angle Theorem(CAT)
- The sum of two angles that add up to 90 degrees
Angle Sum of a Triangle Theorem(ASTT)
- The sum of the three interior angles of any triangle is 180 degrees
Exterior Angle Theorem(EAT)
- The measure of an exterior angle is equal to the sum of the measures of the opposite interior angles
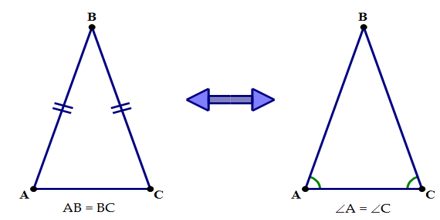
Isosceles Triangle Theorem(ITT)
- The base angles in any isosceles triangle are equal
Sum of The Interior Angle of a Polygon
- The sum of the interioir angles of any polygon is
180(n-2)or180n - 360, wherenis the number of sides of the polygon
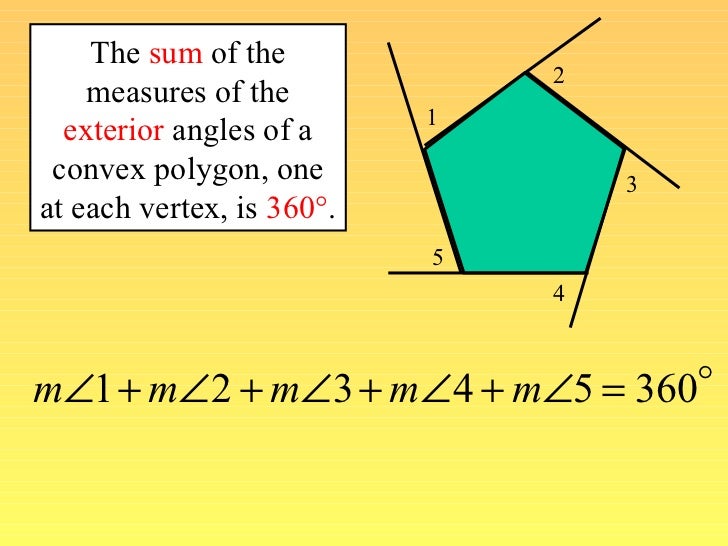
Exterior Angles of a Convex Polygon
- The sum of the exterior angle of any convex polygon is always
360 degrees
Properties of Quadrilaterals
Determine the shape using the properties of it
Figure Properties Scalene Triangle no sides equal Isosceles Triangle two sides equal Equilateral Triangle All sides equal Right Angle Triangle Two sides are perpendicular to each other Parallelogram Opposite sides are parallel and have equal length. Additionally, the diagonals bisect each other Rectangle Adjacent sides are perpendicular to each other. Furthermore, the diagonals bisect each other and are equal in length Square All sides are equal in length. The adjacent sides and diagonals are perpendicular. The adjacent sides are equal in length, so as the diagonals Rhombus Opposite sides are parallel and all sides are equal to each other, the diagonals are perpendicular Trapezoid There is one pair of opposite sides and they are parallel and unequal in length Kite The diagonals are perpendicular
2D Geometry Equations
Shape Formula Picture Rectangle Area: lw
Perimeter: 2(l+w)Triangle Area: bh/2
Perimeter: a+b+cCircle Area: πr2
Circumference: 2πr or πdTrapezoid Area: (a+b)h/2
Perimeter: a+b+c+d
3D Geometry Equations
3D Object Formula Picture Rectangular Prism Volume: lwh
SA: 2(lw+lh+wh)Square Based Pyramid Volume: 1⁄3b2h
SA: 2bs+b2Sphere Volume: 4⁄3πr3
SA: 4πr2Cone Volume: 1⁄3πr2h
SA: πrs+πr2Cylinder Volume: πr2h
SA: 2πr2+2πhTriangular Prism Volume: ah+bh+ch+bl
SA: 1⁄2blh
Optimization (For Maximimizing Area/Volume, or Minimizing Perimeter/Surface Area)
2D Objects
Shape Maximum Area Minimum Perimeter 4-sided rectangle A rectangle must be a square to maximaze the area for a given perimeter. The length is equal to the width
A = lw
Amax = (w)(w)
Amax = w2A rectangle must be a square to minimaze the perimeter for a given area. The length is equal to the width.
P = 2(l+w)
Pmin = 2(w)(w)
Pmin = 2(2w)
Pmin = 4w3-sided rectangle l = 2w
A = lw
Amax = 2w(w)
Amax = 2w2l = 2w
P = l+w2
Pmin = 2w+2w
Pmin = 4w
3D Objects
3D Object Maximum Volumne Minimum Surface Area Cylinder(closed-top) The cylinder must be similar to a cube where h = 2r
V = πr2h
Vmax = πr2(2r)
Vmax = 2πr2The cylinder must be similar to a cube where h = 2r
SA = 2πr2+2πrh
SAmin = 2πr2+2πr(2r)
SAmin = 2πr2+4πr2
SAmin = 6πr2Rectangular Prism(closed-top) The prism must be a cube,
where l = w = h
V = lwh
Vmax = (w)(w)(w)
Vmax = w3The prism must be a cube,
where l = w = h
SA = 2lh+2lw+2wh
SAmin = 2w2+2w2+2w2
SAmin = 6w2Cylinder(open-top) h = r
V = πr2h
Vmax = πr2(r)
Vmax = πr3h = r
SA = πr2+2πrh
SAmin = πr2+2πr(r)
SAmin = πr2+2πr2
SAmin = 3πr2Square-Based Rectangular Prism(open-top) h = w/2
V = lwh
Vmax = (w)(w)(w⁄2)
Vmax = w3⁄2h = w/2
SA = w2+4wh
SAmin = w2+4w(w⁄2)
SAmin = w2+2w2
SAmin = 3w2
Labelling
Given any polygons, labelling the vertices must always:
1. useCAPITAL LETTERS2. they have to be labeled inclockwiseorcounter-clockwisedirections
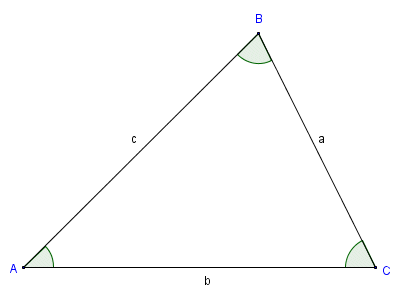
For a triangle, the side lengths are labeled inLOWERCASE LETTERSassociated to the opposite side of the vertex
Median
Each median divides the triangle into 2 smaller triangles of equal area
The centroid is exactlythe way of each median from the vertex, or
the way from the midpoint of the opposite side, or
2:1ratio
The three medians divide the triangle into6smaller triangles of equal area and3 pairsof congruent triangles
Terms:
AltitudeThe height of a triangle, a line segment through a vertex and perpendicular to the opposite side
Orthocenter: where all 3 altitudes of the triangle intersect
>
Midpoint: A point on a line where the length of either side of the point are equal
Median: A line segment joining the vertex to the midpoint of the opposite side
Midsegment: A line joining 2 midpoints of the 2 sides of a triangle
Centroid: The intersection of the 3 medians of a triangle
>
Proportionality theorem:
The midsegment of a triangle is
halfthe length of the opposite side andparallelto the opposite side
Three midsegment of a triangle divide4 congruenttriangles with the same area
The Ratio of the outer triangle to the triangle created by the 3 midsegments is4 to 1
Tips
Make sure to know your optimization formualas
Read the word problems carefully, determine which formual to use
Never ASSUME, be sure to CALCULATE as most of the time the drawings are NOT ACCURATE
To findmissing area, take what you have, subtract what you don’t want
Don’t be afraid to draw lines to help you solve the problem
Analytical Geometry and Linear Relations (5)
Linear Relation: A relation which a single straight line can be drawn through every data point and the first differences are constant
Non - Linear Relation: A single smooth curve can be drawn through every data point and the first differences are not constant
## Slope and Equation of Line
>Slope: The measure of the steepness of a line -rise / runorthe rate of change
>Slope Formula: m = (y2-y1)/(x2-x1)
>Standard Form: ax + by + c = 0, a∈Z, b∈Z, c∈Z (must be integers andamust be positive)
>Y-intercept Form: y = mx + b
>Point-slope Form: y2-y1 = m(x2-x1)
> The slope of a vertical lines is undefined
> The sloope of a horizontal line is 0 > Parallel lines have thesame slope
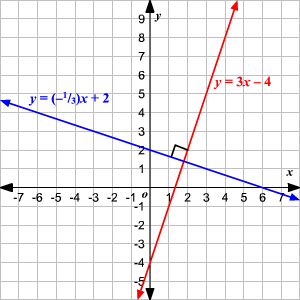
> Perpendicular slopes are negative reciprocals
Relations
A relation can be described using
1. Table of Values (see below)
2. Equations (y = 3x + 5)
3. Graphs (Graphing the equation)
4. Words When digging into the earth, the temperature rises according to the following linear equation: t = 15 + 0.01 h. t is the increase in temperature in degrees and h is the depth in meters.
Perpendicular Lines
To find the perpendicular slope, you will need to find the slope point
Formula: slope1 × slope2 = -1
Notation: m⊥
Definitions
Parallel: 2 lines with the same slope
Perpendicular: 2 lines with slopes that are the negative reciprocal to the other. They form a 90 degree angle where they meet.
Domain: The ordered set of all possible values of the independent variable (x).
Range: The ordered set of all possible values of the dependent variable (y).
Continous Data: A data set that can be broken into smaller parts. This is represented by aSolid line.
Discrete Data: A data set that cannot be broken into smaller parts. This is represented by aDashed line.
First Difference: the difference between 2 consecutive y values in a table of values which the difference between the x-values are constant.
Collinear Points: points that line on the same straight line
Variables
Independent Variable: A Variable in a relation which the values can be chosen or isn’t affected by anything.
Dependent Varaible: A Variable in a relation which is dependent on the independent variable.
Statistics
Interpolation: Data inside the given data set range.
Extrapolation: Data outside the data set range.
Line of Best Fit: A line that goes through as many points as possible, and the points are the closest on either side of the line, and it represents the trend of a graph.
Coefficient of Correlation: The value that indicates the strength of two variables in a relation. 1 is the strongest and 0 is the weakest.
Partial Variation: A Variation that represents a relation in which one variable is a multiple of the other plus a costant term.
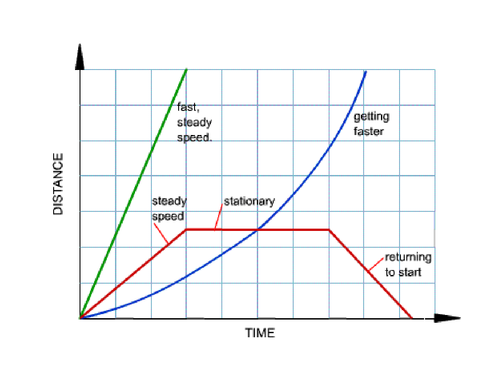
Time - Distance Graph
Time is the independent variable and distance is the dependent variable
You can’t go backwards on the x-axis, as you can’t go back in time
Plot the points accordingly
Draw the lines accordingly
Direction is always referring to:
go towards home
going away from home
stop
Scatterplot and Line of Best Fit
A scatterplot graph is there to show the relation between two variables in a table of values.
A line of best fit is a straight line that describes the relation between two variables.
If you are drawing a line of best fit, try to use as many data points, have an equal amount of points onto and under the line of best fit, and keep it as a straight line.
How To Determine the Equation Of a Line of Best Fit
- Find two points
ONtheline of best fit- Determine the
slopeusing the two points- Use
point-slope formto find the equation of theline of best fit
Table of values
To find first differences or any points on the line, you can use a
table of values
y x First Difference -1 -2 ….. 0 -1 (-1)-(-2) = 1 1 0 0 - (-1) = 1 2 1 1 - 0 = 1 3 2 2 - 1 = 1 4 3 3 - 2 = 1
Tips
Label your graph correctly, the scales/scaling and always the
independent variableon thex-axisand thedependent variableony-axis
Draw yourLine of Best Fitcorrectly
Read the word problems carefully, and make sure you understand it when graphing things
Sometimes its better not to draw the shape, as it might cloud your judgement (personal exprience)
Label your lines
System of Equations (6)
Linear System
Two or more equation that you are working on all together at once on the same set of axes.
The lines maycrossorintersectat a point called thePoint of Intersection (POI).
The coordinated of thePOImust satisfy the equation of all the lines in a linear equation.
In business, the
Point of Intersectionis known as the Break Even Point whereRevenue - Cost = Profit
when Profit = 0. There is no gain or loss.
Number of Solutions
Discriminant
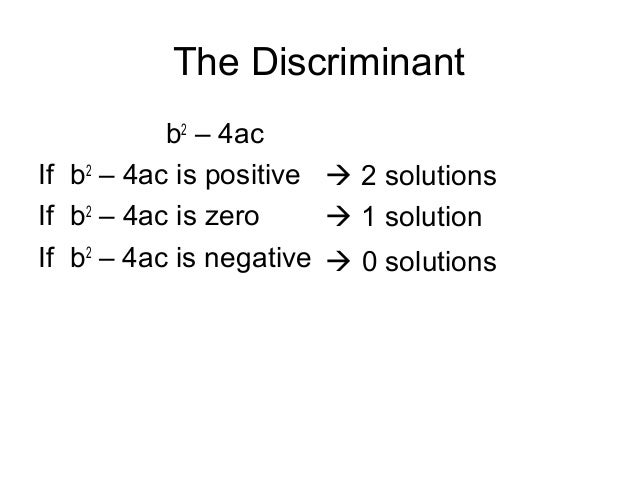
The discriminant determines the number of solutions (roots) there are in a quadratic equation.
a,b,care the coefficients and constant of a quadratic equation:y = ax<sup>2</sup> + bx + c
D = b2 - 4ac
D > 0(2 distinct real solutions)
D = 0(1 real solution)
D < 0(no real solutions)
Solving Linear-Quadratic Systems
To find the point of intersection, do the following:
1. Isolate both equations fory2. Set the equations equal to each other bysubsitutionEquation 1 = Equation 2 3. Simplify and put everything on one side and equal to zero on the other side 4. Factor 5. Use zero-product property to solve for all possible x-values 6. Subsitute the x-values to one of the original equations to solve for all y-values 7. State a conclusion / the solution
There are 3 possible cases
In addition, to determine the number of solutions, you the Discriminant formula D = b2 - 4ac
Ways to solve Systems of Equations
- Subsitution
Here we eliminate a variable by subbing in another variable from another equation
We usually do this method if a variable is easily isolated
Example:
y = x + 10 (1) x + y + 34 = 40 (2)We can sub (1) into (2) to findx, then you the value ofxwe found to solve foryx + (x + 10) + 34 = 40
2x + 44 = 40
2x = -4
x = -2
Then solve fory
y = -2 + 10
y = -8
- Elimination Here we eliminate a variable by basically eliminate a variable from an equation
We usually use this method first when the variables are not easily isolated, then use subsitution to solve
Example:
2x + 3y = 10 (1) 4x + 3y = 14 (2) ``` We can then use eliminationThen sub the value of4x + 3y = 14 2x + 3y = 10 ------------ 2x + 0 = 4 x = 2 ```xinto an original equation and solve fory
2(2) + 3y = 10
3y = 6
y = 2
- Graphing we can rewrite the equations into
y-intercept formand then graph the lines, and see where the lines intersect (P.O.I), and the P.O.I is the solution
Solving Systems of Linear Inequalities
Find the intersection region as the
solution.
## If:
Use DashlineUse Solid lineShade the region abovethe liney > mx + b y ≥ mx + b Shade the region belowthe liney < mx + b y ≤ mx + b
If
x > a
x ≥ ashade the region on the right
If
x < a
x ≤ ashade the region on the left
Step 1. change all inequalities to
y-intercept form
Step 2. graph the line
Step 3. shade the region where all the regions overlap
Tips
Read the questions carefully and model the system of equations correctly
Be sure to name your equations
Label your lines
General Tips
Be sure to watch out for units, like
cmorkm
Watch out for+/-
Be sure to reverse the operation when moving things to the other side of the equation
Make sure to have a proper scale for graphs
Read question carefully and use the appropriate tools to solve
WATCH OUT FOR CARELESS MISTAKES!!!!!!!!!!!
Word Problems
Read carefully
model equations correctly
Rereadthe question over and over again until you fully understand it and made sure there is no tricks. :p
LetsStatement
Conclusion
Graph Problems
Look up on tips in units (5) and (6)
be sure to use a ruler when graphing
System of Equations
When in doubt or to check your work, just plug the numbers back in and check if the statement is true
Credits
Ryan Mark - He helped provide alot of information for me
Ms Hung(Katie) - She helped me check over my study sheet, an amazing teacher!
Magicalsoup - ME!
