25 KiB
Study Sheet
Unit 1: Diagnostic & Essential Number Skills
Rounding and Decimals
Decimals
Terms:
- Given the number
9123.456:- The
tenthis the4. - The
hundredthis5. - The
thousandthsis6. - The
onesis3. - The
tensis5. - The
hundredsis1. - The
thousandsis9. - Remember,
tensandtenthsmay sound the same, but they areDIFFERENT!
- The
- Given the number
- To round to a
tenth,hundredth, andthousandths- Tenths
- If the
hundredthis5or higher, round up, else, round down. - Example:
- Round
12.53223to the tenths - The answer is
12.5, as the hundredths, or3is smaller than 5.
- Round
- If the
- Hundredth
- If the
thousandthis5or higher, round up, else, round down. - Example:
- Round
12.53521to the hundredth - The answer is
12.4, as the thousandths, or5is bigger or equal to 5.
- Round
- If the
- Thousandth
- If the number of the
thousandthis5or higher, round up, else, round down.
- Example:
- Round
12.5356to the thousandths - The answer is
12.536, as the number after the thousandths, or6is bigger than 5.
- Round
- If the number of the
- Tenths
- To round to a
ones,tens,hundreds, andthousands- Ones
- If the
tenthsis5or higher, round up, else, round down. - Example:
- Round
123.5333to the ones - The answer is
124, as the tenths, or5is bigger than or equal to 5.
- Round
- If the
- Tens
- If the
onesis5or higher, round up, else, round down. - Example:
- Round
123.5777to the tens - The answer is
120, as the ones, or3is smaller than or equal to 5.
- Round
- If the
- Hundreds
- If the
tensis5or higher, round up, else, round down. - Example:
- Round
177.34343to the hundreds - The answer is
200, as the tens, or7is bigger than 5.
- Round
- If the
- Thousands
- If the
hundredsis5or higher, round up, else round down. - Example:
- Round 566.777` to the thousands
- The answer is
1000, as the hundreds, or5is bigger or equal to 5.
- If the
- Ones
Integers
Multiplication and Division
Pretend
aandbare random positive numbersType Outcome a × b Positive number a × (-b) Negative number (-a) × b Negative number (-a) × (-b) Positive number a ÷ b Positive number a ÷ (-b) Negative number (-a) ÷ b Negaitve number (-a) ÷ (-b) Positive number Treat as normal divion and multiplacation, and just add the negative sign infront of the number according to the rules above.
Practice
- 8 × -7
- Answer:
-56
- Answer:
- 2 × 4
- Answer:
8
- Answer:
- -7 × -7
- Answer:
1
- Answer:
- -10 × 4
- Answer:
-40
- Answer:
- 8 ÷ 4
- Answer:
2
- Answer:
- -16 ÷ -8
- Answer:
2
- Answer:
- -4 ÷ 1
- Answer
-4
- Answer
- 9 ÷ -3
- Answer:
-3
- Answer:
- 8 × -7
Addition and Division
Pretend
aandbare random postive numbers.Type Equivalent a + b a + b b + a b + a a+(-b) a - b (-a)+b b-a a-b a-b b-a b-a a-(-b) a+b (-a)-b -(a+b)
Order Of Operation
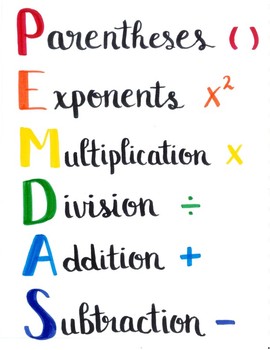
- BEDMAS
- Follow
BEDMASfor order of operations if there are more than one operation
| Letter | Meaning |
|---|---|
| B / P | Bracket / Parentheses |
| E | Exponent |
| D | Divison |
| M | Multiplication |
| A | Addition |
| S | Subtraction |
- Follow order of operation, inorder to do know which operation to do first.
- Example: Given \(`(2+4) \times 5 - 9 \div
3`\)
- First do everything in brackets: \(`(6) \times 5 - 9 \div 3`\)
- Then do multiplication/division: \(`30 - 3`\)
- Then finally, do subtaction/addition: \(`27`\)
- The answer is
27.
Fractions / Rational Numbers
- The number on the top is called the
numerator. - The number on the bottom is called the
denominator. - A fraction in its most simple form is when the
numeratoranddenominatorcannot be both divided by the same number.
Additions / Subtractions With Fractions
- Example: \(`\frac{3}{5} + \frac{4}{3}`\)
- Find
common denominator, which is15, as5and3both are factors of15.- You can do this easily with a table, just count by the number you are using, for example:
Counting by 5s Counting by 3s 5 3 10 6 15 9 20 12 25 15 - As you can see, both columns contain the number
15, so15is the common denominator. - Now, after we find the denominator, we must convert the fraction so
that it has the
common denominator. To do this, we must multiply the denominator by a number, so that it equals thecommon denominator. For the first fracion \(`\frac{3}{5}`\), thedenominatoris5, to get to15, we must multiply it by3. Now, whatever we do on the bottom, me MUST do it on the top too, so we also multiply thenumeratorby3as well, the new fraction is now \(`\frac{3 \times 3}{5 \times 3} = \frac{9}{15}`\). - We now do the same thing to the other fraction: \(`\frac{4 \times 5}{3 \times 5} = \frac{20}{15}`\)
- Now that the denominators are the same and the fractions are
converted, we can just simply add the
numeratorstogether while keeping thedenominatorthe same. The result is \(`\frac{9 + 20}{15} = \frac{29}{15}`\). - The same steps applied to subtracion, with the only difference of subtacting the numerators rather than adding them.
Multiplaction With Fractions
- To multiply a fracion, simply multiply the
numeratorstogether, and thedenominatorstogether. - Example: \(`\frac{3}{6} \times
\frac{7}{4}`\)
- Answer: \(`\frac{3 \times 7}{6 \times 4} = \frac{21}{24}`\)
Division With Fractions
- To divide 2 fractions, flip the second fraction upside down and multiply them togehter.
- Or, in advanced terms, mulitply the first fraction by the reciporocal of the second fraction.
- Given an example: \(`\frac{4}{2} \div
\frac{6}{9}`\)
- First, flip the second fraction upside down: \(`\frac{4}{2} \div \frac{9}{6}`\)
- Then change the division to a multiply: \(`\frac{4}{2} \times \frac{9}{6}`\)
- Then multiply the 2 fractions \(`\frac{4 \times 9}{2 \times 6} = \frac{36}{12}`\)
Unit 2: Measurement
Measuring Perimeter and Area
2D Shapes
| Shape | Formula | Picture |
|---|---|---|
| Rectangle | Area: \(`lw`\) Perimeter: \(`2(l+w)`\) |
|
| Triangle | Area: \(`\frac{bh}{2}`\) Perimeter: \(`a+b+c`\) |
|
| Circle | Area: \(`πr^2`\) Circumference:
\(`2πr`\) or \(`πd`\) |
|
| Trapezoid | Area: \(` \frac{(a+b)h}{2}`\) Perimeter: \(`a+b+c+d`\) |
Right Triangle and Pythagorean Theorem
aandbare the two legs of the triangle or two sides that form a 90 degree angle of the triangle,cis the hypotenuse
\(`a^2+b^2=c^2`\)

Area of Composite Figures
- You can cut any normal polygon into standard polygons you know, for example, a polygon shaped as a house can be split into a recntalge and a triangle. All normal polygon, can be simplified into triangles.
Perimeter of Composite Figures
- Same as an area of composite figures, cut them down into much simplified shapes so you can easily calculate its area. Alternatively, if its possible, you can even measure the shape using a tool such as ruler.
3D Objects
| 3D Object | Formula | Picture |
|---|---|---|
| Rectangular Prism | Volume: \(`lwh`\) SA: \(`2(lw+lh+wh)`\) |
|
| Square Based Pyramid | Volume: \(`\frac{1}{3} b^2 h`\) SA:
\(`2bs+b^2`\) |
|
| Sphere | Volume: \(`\frac{4}{3} πr^3`\) SA:
\(`4πr^2`\) |
|
| Cone | Volume: \(` \frac{1}{3} πr^2 h`\) SA: \(`πrs+πr^2`\) |
|
| Cylinder | Volume: \(`πr^2h`\) SA: \(`2πr^2+2πh`\) |
|
| Triangular Prism | Volume: \(`ah+bh+ch+bl`\) SA: \(` \frac{1}{2} blh`\) |
Unit 3: Optimization
Optimization (For Maximimizing Area/Volume, or Minimizing Perimeter/Surface Area)
2D Shapes
| Shape | Maximum Area | Minimum Perimeter |
|---|---|---|
| 4-sided rectangle | A rectangle must be a square to maximaze
the area for a given perimeter. The length is equal to the
width \(`A = lw`\) \(`A_{max} = (w)(w)`\) \(`A_{max} = w^2`\) |
A rectangle must be a square to minimaze
the perimeter for a given area. The length is equal to the
width. \(`P = 2(l+w)`\) \(`P_{min} = 2(w)(w)`\) \(`P_{min} = 2(2w)`\) \(`P_{min} = 4w`\) |
| 3-sided rectangle | \(`l =
2w`\) \(`A = lw`\) \(`A_{max} = 2w(w)`\) \(`A_{max} = 2w^2`\) |
\(`l =
2w`\) \(`P = l+2w`\) \(`P_{min} = 2w+2w`\) \(`P_{min} = 4w`\) |
Unit 4: Relationship in Geometry
Angles
| Angle | Description | Example |
|---|---|---|
| Acute Angle | Less than 90 degrees |  |
| Right Angle | 90 degrees |  |
| Obtuse Angle | More than 90 degrees |  |
| Straight Angle | 180 degrees |  |
| Reflex Angle | More than 180 degrees |  |
Angle Theorems
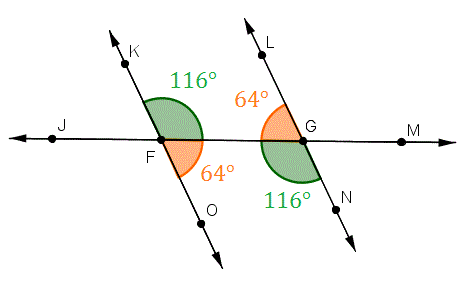
1. Transversal Parallel Line Theorems (TPT)
- Alternate Angles are Equal
(Z-Pattern)
- Corresponding Angles Equal
(F-Pattern)
- Interior Angles add up to 180
(C-Pattern)
2. Supplementary Angle Triangle (SAT)
When two angles add up to 180 degrees

3. Opposite Angle Theorem (OAT) (OAT)
Two lines intersect, two angles form opposite. They have equal measures

4. Complementary Angle Theorem (CAT)
The sum of two angles that add up to 90 degrees

5. Angle Sum of a Triangle Theorem (ASTT)
The sum of the three interior angles of any triangle is 180 degrees

6. Exterior Angle Theorem (EAT)
- The measure of an exterior angle is equal to the sum of the measures of the opposite interior angles
-
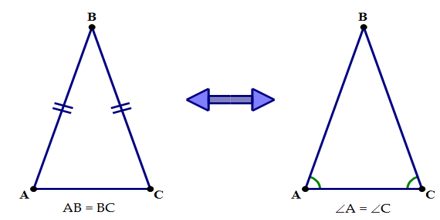
7. Isosceles Triangle Theorem (ITT)
The base angles in any isosceles triangle are equal
8. Sum of The Interior Angle of a Polygon
The sum of the interioir angles of any polygon is
180(n-2)or180n - 360, wherenis the number of sides of the polygon
9. Exterior Angles of a Convex Polygon
The sum of the exterior angle of any convex polygon is always
360 degrees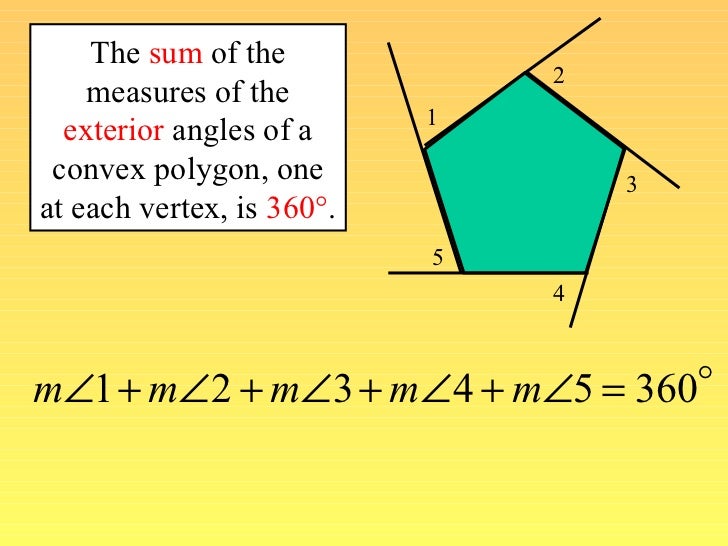
Unit 5: Proportional Reasoning
Equivalent Ratios
An easy way to see if ratios are equivalent is to see if the ratios are the same in its simpliest form. A ratio is a fraction in essence, the first number is the
numerator, and the second number is thedemominator.An easy way to find an equivalent ratio is just to multiply the everything by 2, for example, given a ratio
2:5, multiply everything by 2, so your new ratio will be2x2:5x2 = 4:10.
Ratio and Proportions
- Ratios link directly with proportions, as a ratio of one thing can be applied to another ratio of another thing.
- Example
- Given one ratio of one triangle’s height to base and another ratio of another triangle’s heigth to base, we can find one missing side length given that we have the other 3.
- Lets say the 2 ratios are
1:5and3:x, given thatxis a random number. - To solve
x, we can cross-multiply, or multipling thenumeratorswith thedenominatorsand setting them equal to each other. Thus, we can first make the ratios into fractions and then do: \(`\frac{1}{5} \text{ cross-multiply } \frac{3}{x} \rightarrow 1x = 3 \times 5`\). Which we can then solve forx, which is15.
Solving Algebraic Equations
- To solve equations, just remove the extra bits on both sides by doing the opposite. So if its addition, do subraction to get rid of the added numbers, and vice versa:
| Example | To solve: |
|---|---|
| \(`x + 3 = 15`\) | \(`(x + 3)-3 =
15-3`\) \(`x = 12`\) |
| \(`x - 3 = 15`\) | \(`(x - 3)+3 =
15+3`\) \(`x = 18`\) |
| \(`x \div 3 = 15`\) | \(`(\frac{x}{3})
\times 3 = 15 \times 3`\) \(`x = 45`\) |
| \(`x \times 3 = 15`\) | \(`\frac{x
\times 3}{3} = \frac{15}{3}`\) \(`x = 5`\) |
Fraction to Decimal
- Simply divide the
numeratorby thedenominator. So \(`\frac{3}{4} = 3 \div 4, \text{or } 0.75`\). ## Fraction to Percent - The percentage symbol
%, means the number has been multiplied by 100, so given a fraction \(`\frac{3}{4}`\), convert the fraction into a decimal. Then multiply that decimal by100. - \(`\frac{3}{4} = 0.75 \rightarrow 0.75 \times 100 = 75\%`\)
Percent as a Ratio
- Simply divide the first number by the second number, and multiply by
one
100. It is the same as making the ratio into a fraction, then converting the fraction into a percentage.
Unit 6: Graphing Relations
Definitions
relation: describes how one variable is connected to another.Axis(plural is axes):- Vertical: used for dependent variable.
- Horizontal: used for independent variable.
Variable: a letter or symbol used to represent a quantity that changes- Independent variable is NOT controlled/affecet by another variable
- Dependent variable is one that IS controlled/affected by the independent variable.
Trend: a general direction or tendencyLine of best fit: a line that passes as close as possible to a set of plotted points- a correlation describes how well one variable
relates to another. Possible types of correltaion:
- positive
- negative
- none
- strong
- weak
- a correlation describes how well one variable
relates to another. Possible types of correltaion:
Curve of best fit: a curve that passes as close as possible to as set of plotted points.Interpolation: Data inside the given data set range.
Extrapolation: Data outside the data set range.
Graphs:
Title: Name given to a graph and placed above the graph.Axis Label: Axes are labeled with the scale, what was measured and its units.Scale: evenly spaced numbers which differ by an equal amount. Note: the scale may have a break at the beginning.
Interpreting Scatter Plots
- A scatterplot graph is there to show the relation between two
variables in a table of values.
- A line can be drawn through the most concentrataed points, to show a trend.
- Given a value, to find the other value, use follow the line that the
dot is on and check the value on the other axis. For example, if a point
is on
(1, 2), if you are given2, to get1, just following the vertical line to find the corresponding number on thex-axis.
- Given a value, to find the other value, use follow the line that the
dot is on and check the value on the other axis. For example, if a point
is on

Line Of Best Fit
- A line that represents the
trendin a graph. ### How To Find The Line of Best Fit
- Simply draw the line according to the properties of the line below.
- Use a ruler when drawing the line.
- Make sure the line of best fit represents the trend.
Properties Of Line Of Best Fit
- Shows the trend for the data in a scatter plot.
- Shows the pattern and direction of the data points.
- Should pass through as many points as possible.
- Remaining points should be grouped equally above and below the line and spread out along the line.
- Helps make predictions for values not actually recorded and plotted.
Curve Of Best Fit
- A curve that represents the
trendin a graph.
How To FInd The Curve Of Best Fit
- Simply draw a curve that connects all the points.
- You can also use an online graphing calculator, like DESMOS.
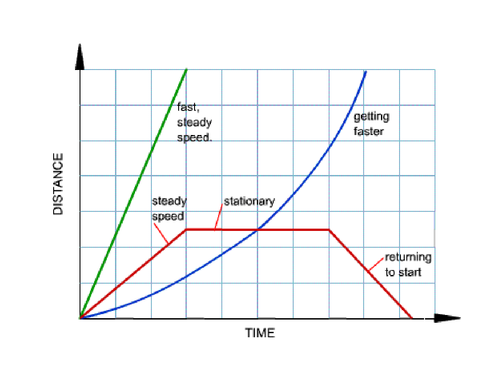
Time - Distance Graph
- Time is the independent variable and distance is the dependent
variable
- You can’t go backwards on the x-axis, as you can’t go back in
time
- Plot the points accordingly
- Draw the lines accordingly
Direction is always referring to:
go towards home
going away from home
stop
Graphing Linear Relations
- A linear relation is a
straight line.
Graphing Using Table Of Values
- To graph the relation, first look at the
Table of Values. - Then decide which columns are the x and y axis.
- Then do a scatter plot/graph, where the numbers are the points.
- Example:
- Given the table of values:
Hours Worked Pay in dollars 3 100 6 200 9 300 12 400 - First label the x and y axis, since time is the independent
variable, the
Hours Workedwill bex-axis. ThePay in dollarswill be our y-axis.
Graphing Non-Linear Relations
- Plot the points in a scatter plot.
- Use one smooth curve to connect all the points.
Unit 7: Linear Relations
- Cartesian Coordination System: its a coordinate system that has 4 grids, with x and y values.
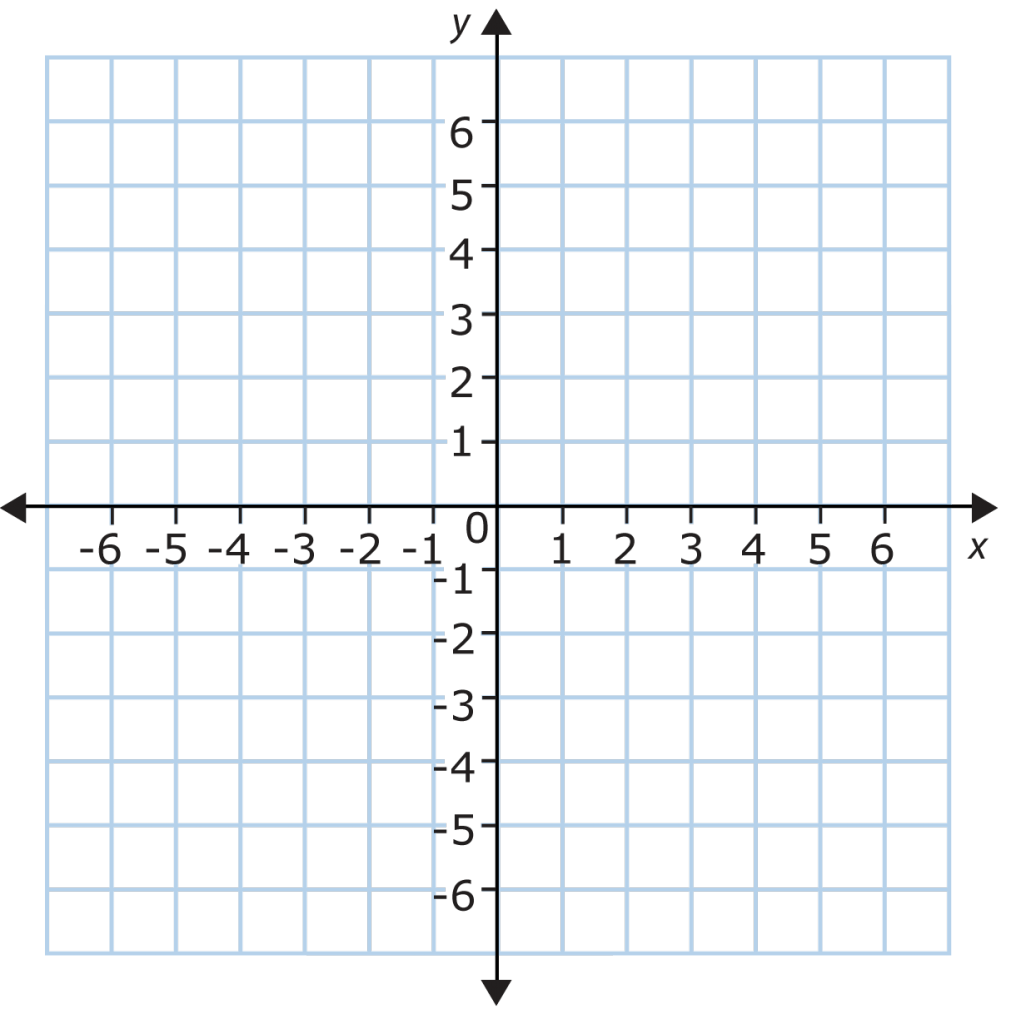
Direct Variation: A line that passes through or from theorigin. Simply put, there is a point where the x and y values both equal to 0.Partial Variation: A line that does not pass through or from theorigin. Simply put, there isn’t a point where the x and y values both equal to 0.
Recognizing Linear Relations
- Use either
table of valuesor a graph to determine it. - If the
first differencesin the table of value is constant, it is a linear relation. - If the line that connects all the points is a straight line, it is a linear relation.
Average Speed As Rate Of Change
- \(` \text{average speed} = \frac{\text{Distance Traveled}}{\text{Time Taken}}`\)
- The average speed, is simply equal to the rate of change.
Solving Equations
Equation: When the alegebraic expression are set to equal to each other.Variable: A number that can change (varies) \(`\rightarrow`\) unknown.Constant: A number that always stays the same (doesn’t vary).To solve an equation is: fidn the value of the variable (unknown), so that the left side of the equation and the right side of the equation are equal.
Tips
- Remember if you do something to one side, you must do it to the other.
- Make sure to flip the negative/positive sign when moving an value to the other side.
Deteriming Values in a Linear Relation
Steps
- Enter the data given in the question into this table.
- Graph the data, Join the points with a line.
- Determine the rate of change.
- Extend the line on the graph to the left until it intersects the vertical axis.
- Simply use the graph, by either looking at the x or y axis to solve the questions that are given.
Two Linear Equations
- Plot the points and draw the lines for all the equations.
- The point where they intersect is called the point of intersection, and is when the equations equal to one another (the x and y values).
- In terms of money, the less steep the line, the better the deal is.
Unit 8: Polynomials
like terms: are variables that have the same name and are raised to the same power (eg. \(`x^2 \text{and } 2x^2`\))unlike terms: are variables that have the same name and are not raised to the same power (eg \(`x^2 \text{and } x`\)).
Summing Polynomials
- If there are brackets, first simplify and expand them.
- Simply collected the
like-termsand simplify them.
- Eg. \(`(2x^2+2x+3) + (7x + x^2 - 5)`\)
- First you expand/open the brackets.
- \(`= 2x^2 + 2x + 3 + 7x + x^2 - 5`\)
- Then you collect the like terms and group them together.
- \(`= 2x^2 + x^2 + 2x + 7x + 3 - 5`\)
- Then you simplify.
- \(`= 3x^2 + 9x - 2`\)
Subtracting Polynomials
- You Simply do the same thing as summing polynomials, except to you
need to be careful and apply distributive property with
the
-1wherever neccessary. - Eg. \(`(4x^2 - 5) - (3 - x^2)`\)
- First open the bracets.
- \(`= 4x^2 - 5 - 3 + x^2`\)
- Group like terms together.
- \(`= 4x^2 + x^2 - 5 - 3`\)
- Simplify
- \(`= 5x^2 - 8`\)
Multiplying Polynomials With A Constant
- To do this, you simply apply the distributive property.
- Eg. \(`-5(x^2 - 3x + 4)`\)
- Apply distributive property.
- \(`= -5(x^2) + 5(3x) -5(4)`\)
- Then open the brackets by multiply the numbers together.
- \(`= -5x^2 + 15x - 20`\)
Multiplying Polynomials With A Monomial.
- To do this, you also use distributive property
- Simply multiply everything in the polynomial by the monomial.
- Eg.\(`4x(3x^2 + 5x - 3)`\)
- Use distributive property and open the brackets.
- \(`= 4x(3x^2) + 4x(5x) + 4x(-3)`\)
- Then you reformat the numbers.
- \(`= (4)(3)(x)(x)(x) + (4)(5)(x)(x) + (-3)(4)(x)`\)
- And simplify.
- \(` = 12(x^3) + 20(x^2) + -12(x)`\)
- \(` = 12x^3 + 20x^2 - 12x`\)
Multiplying A Monomial With A Monomial
- To do this, simply reformat the variables after multpilication (distributive property), and simplify.
- Eg. \(`4x(-12x)`\)
- Use distributive property and reforat the numbers.
- \(`= (4)(-12)(x)(x)`\)
- Then you simplify.
- \(`= (-48)(x^2)`\)
- \(`= -48x^2`\)
Solving Equation
- To solve a equation, is to find the missing value and make sure the left side and the right side are equal.
- Remember, to solve an equation, it usually requires multiple steps.
- First simplify as much as you can.
- Use distributive property and open brackets if there are any.
- Regroup the terms.
- Simplify Again (use distributive property whereever nescessary).
- Check.
Tips
- Watch out for negatives signs.
- Make sure to label your graph CORRECTLY, with the proper x and y axis.
Credits
- Made by Magicalsoup(James)
